MOBILE BEHAVIORAL DATA
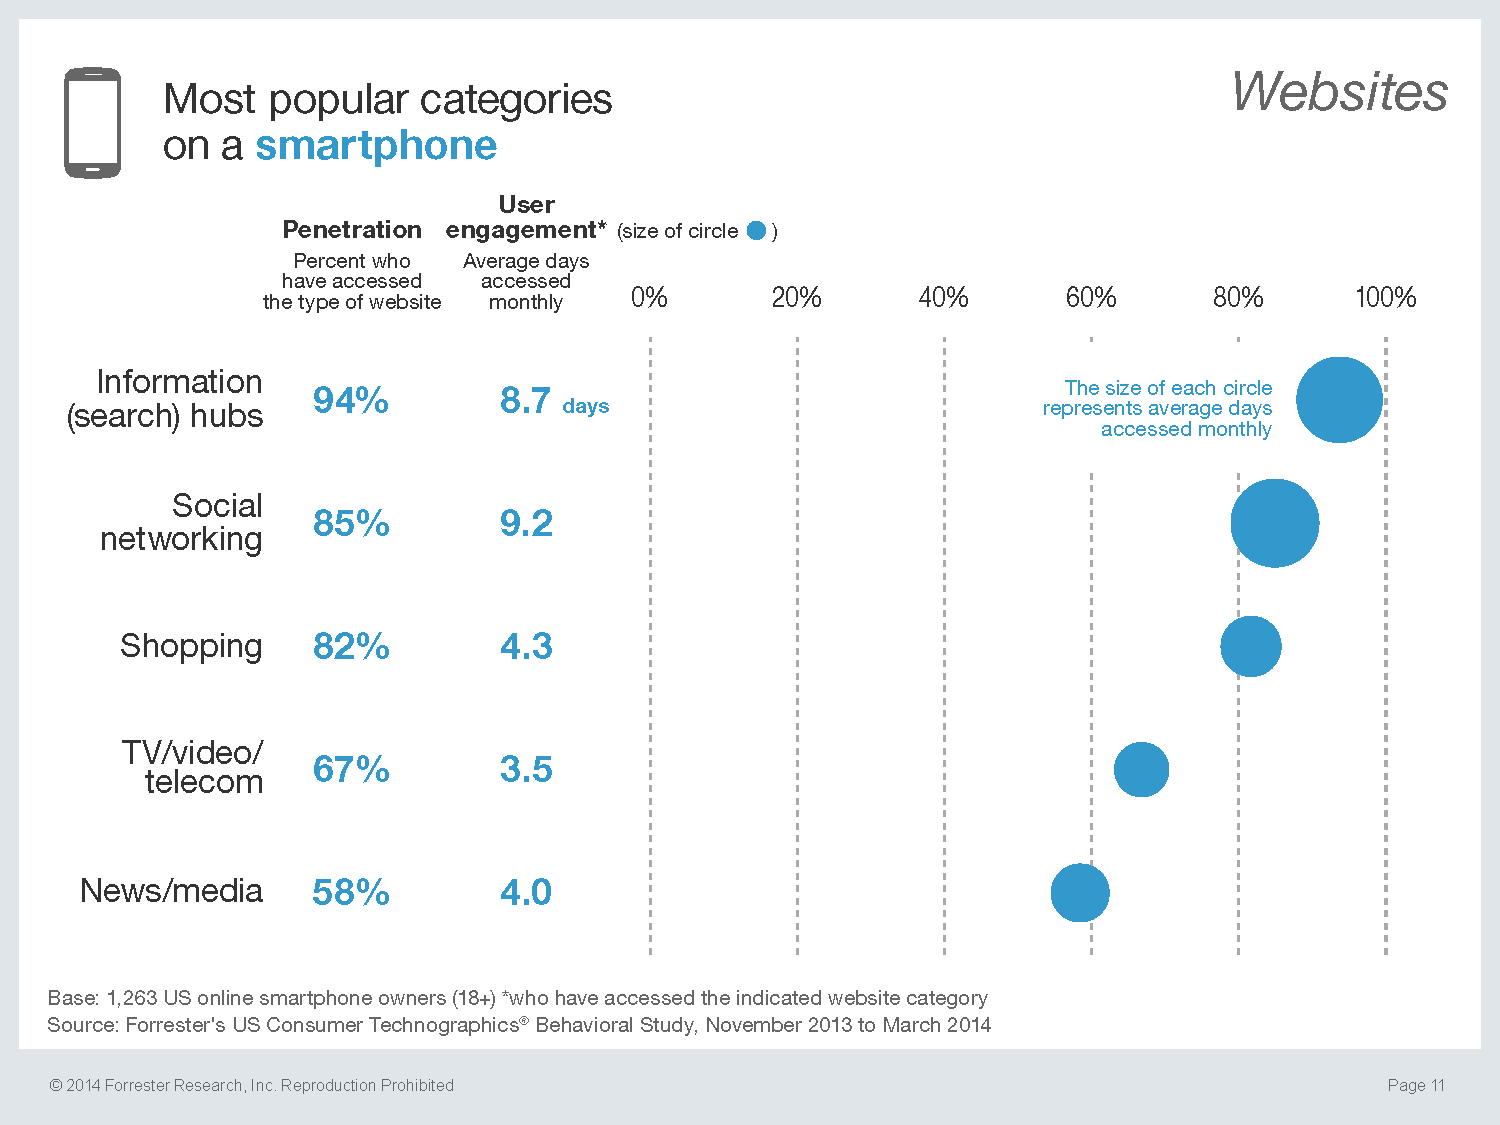
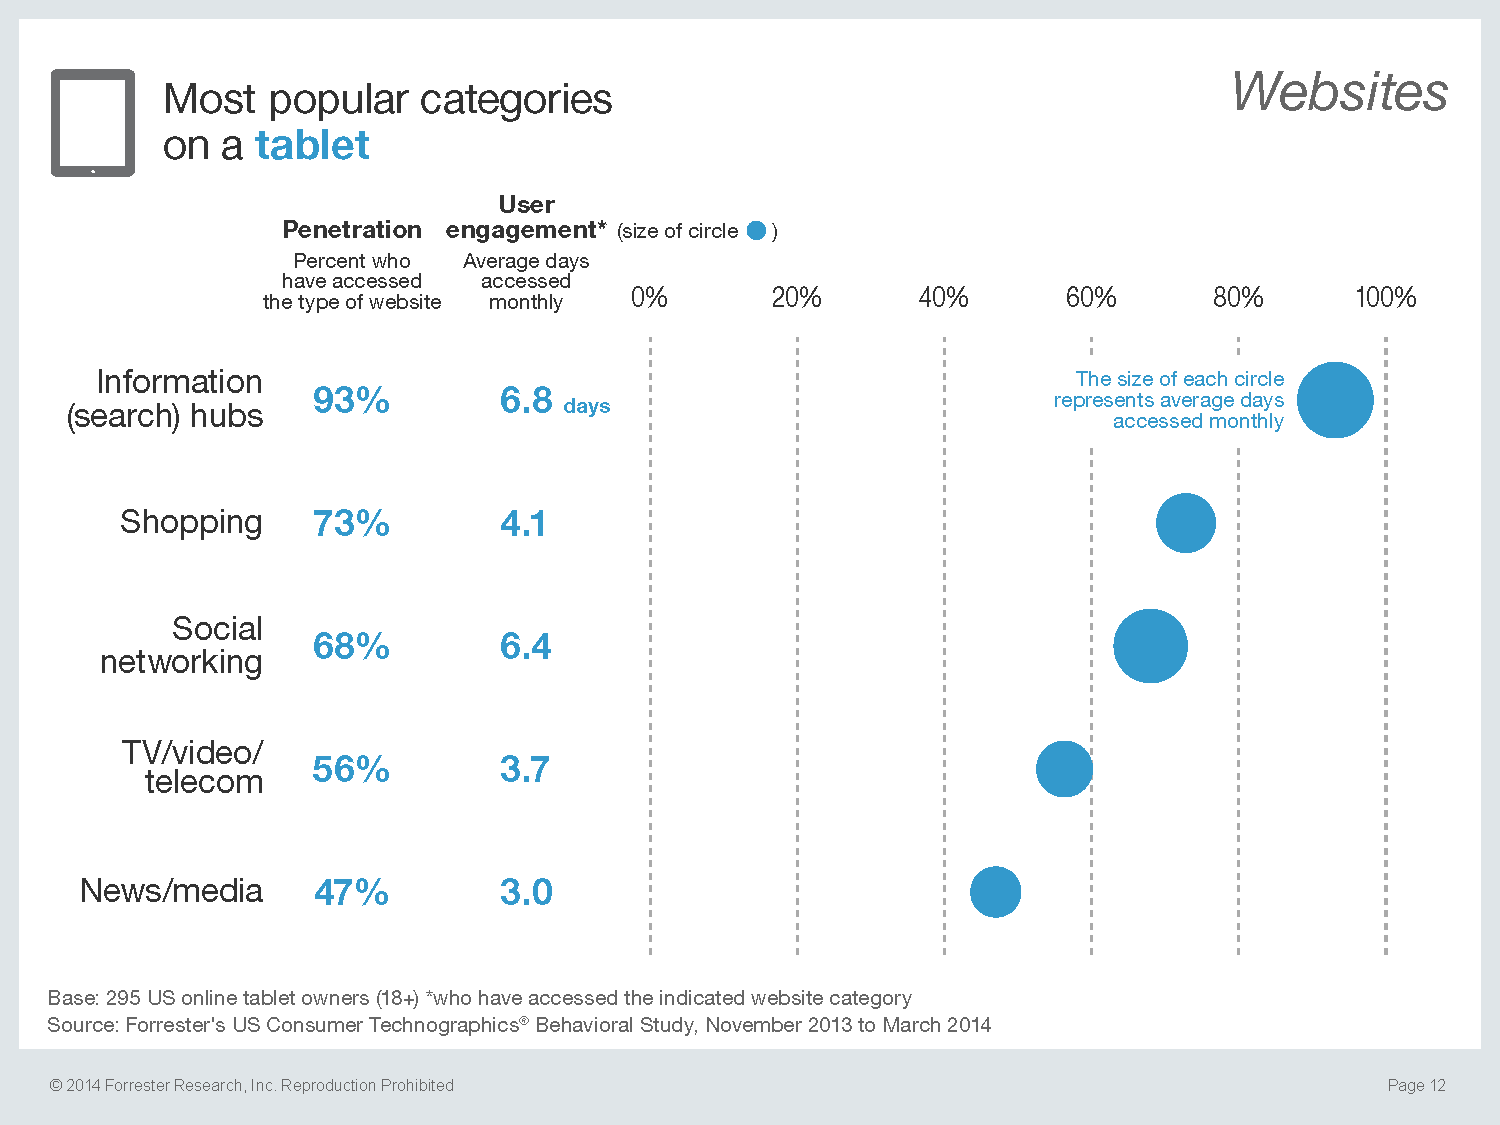
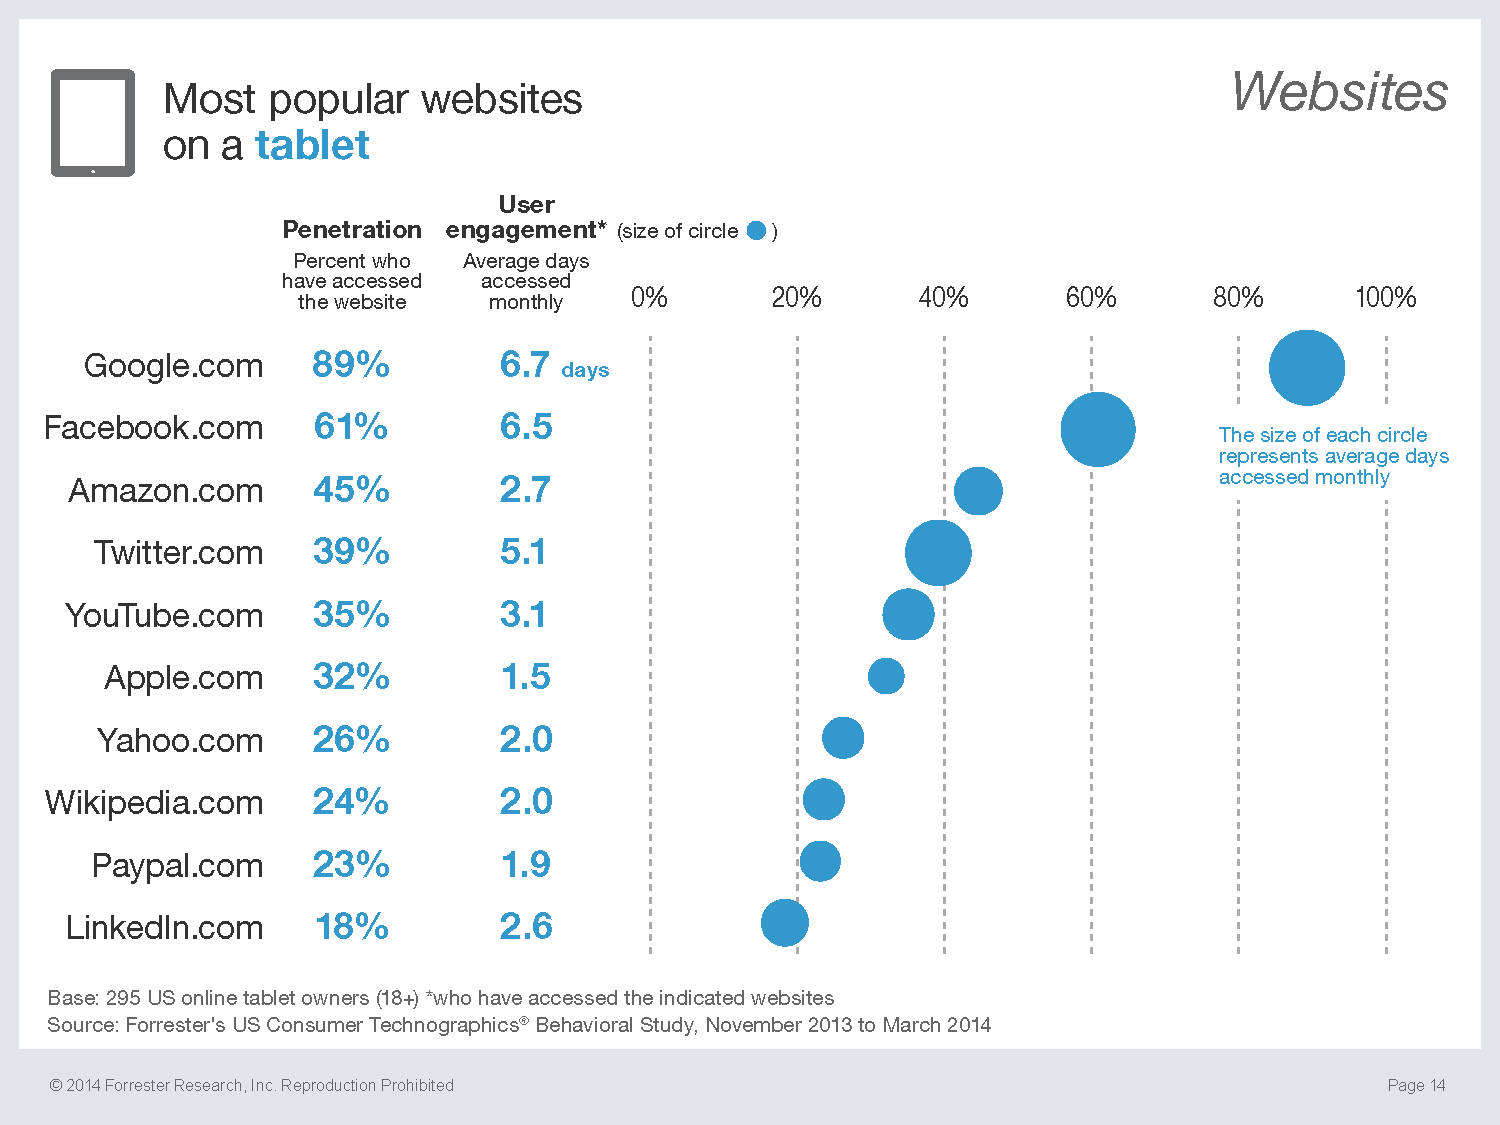
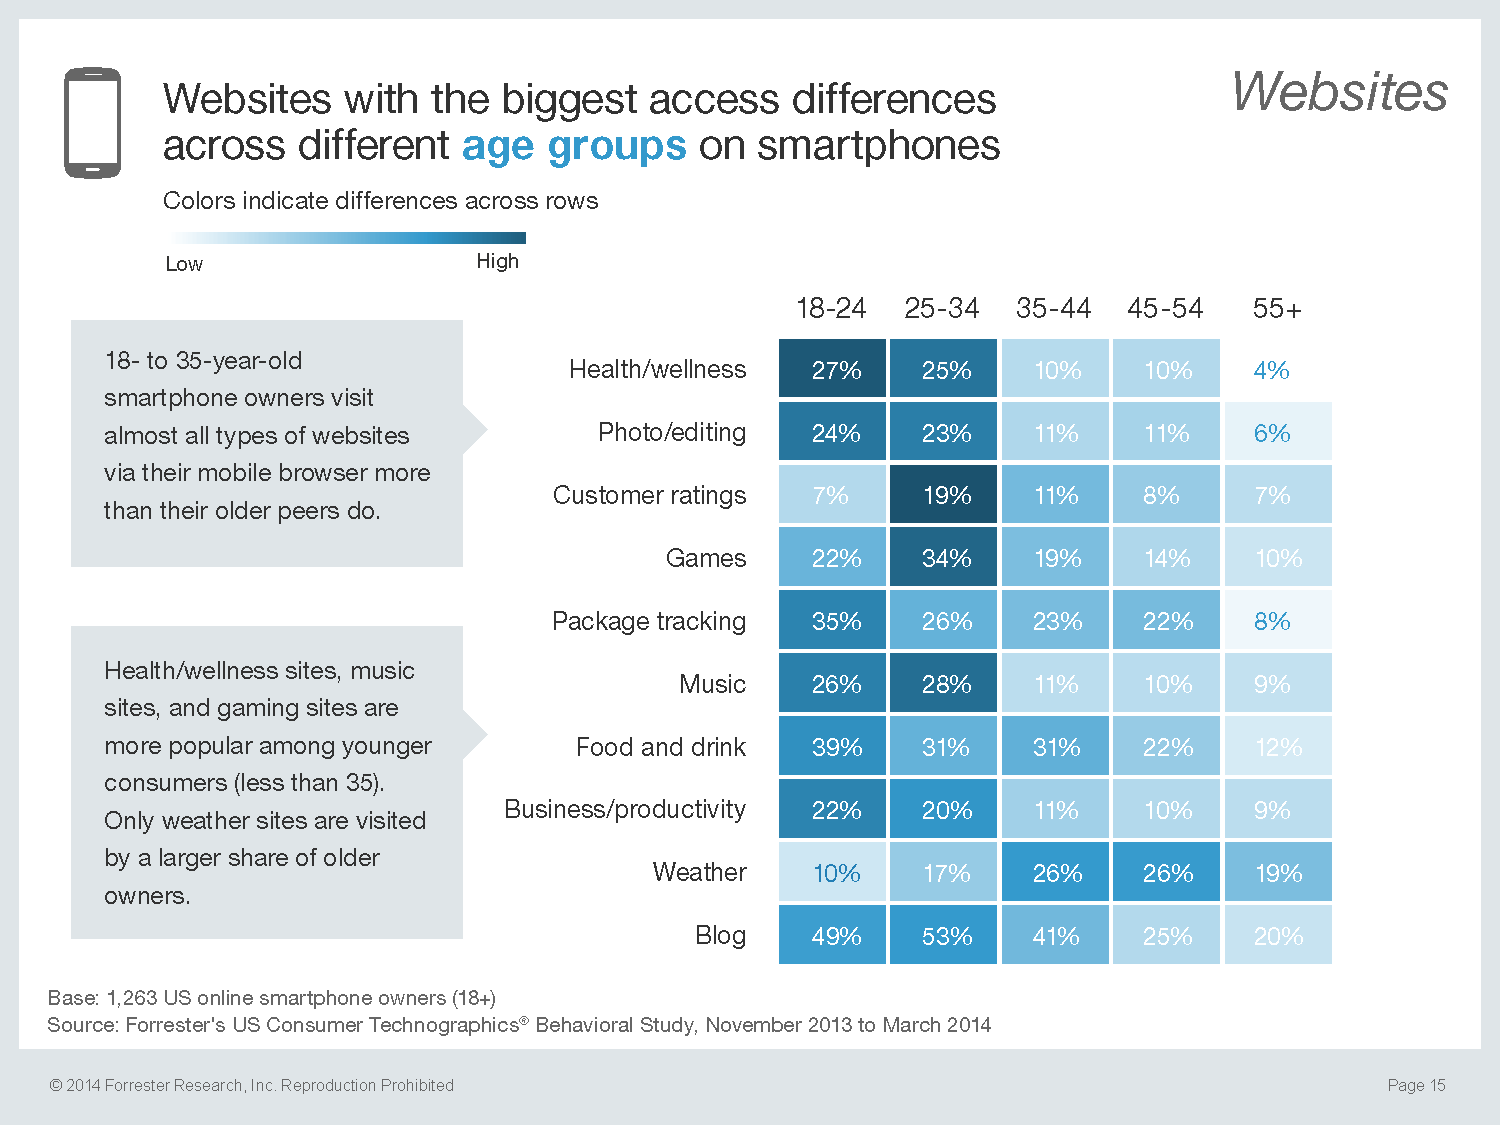
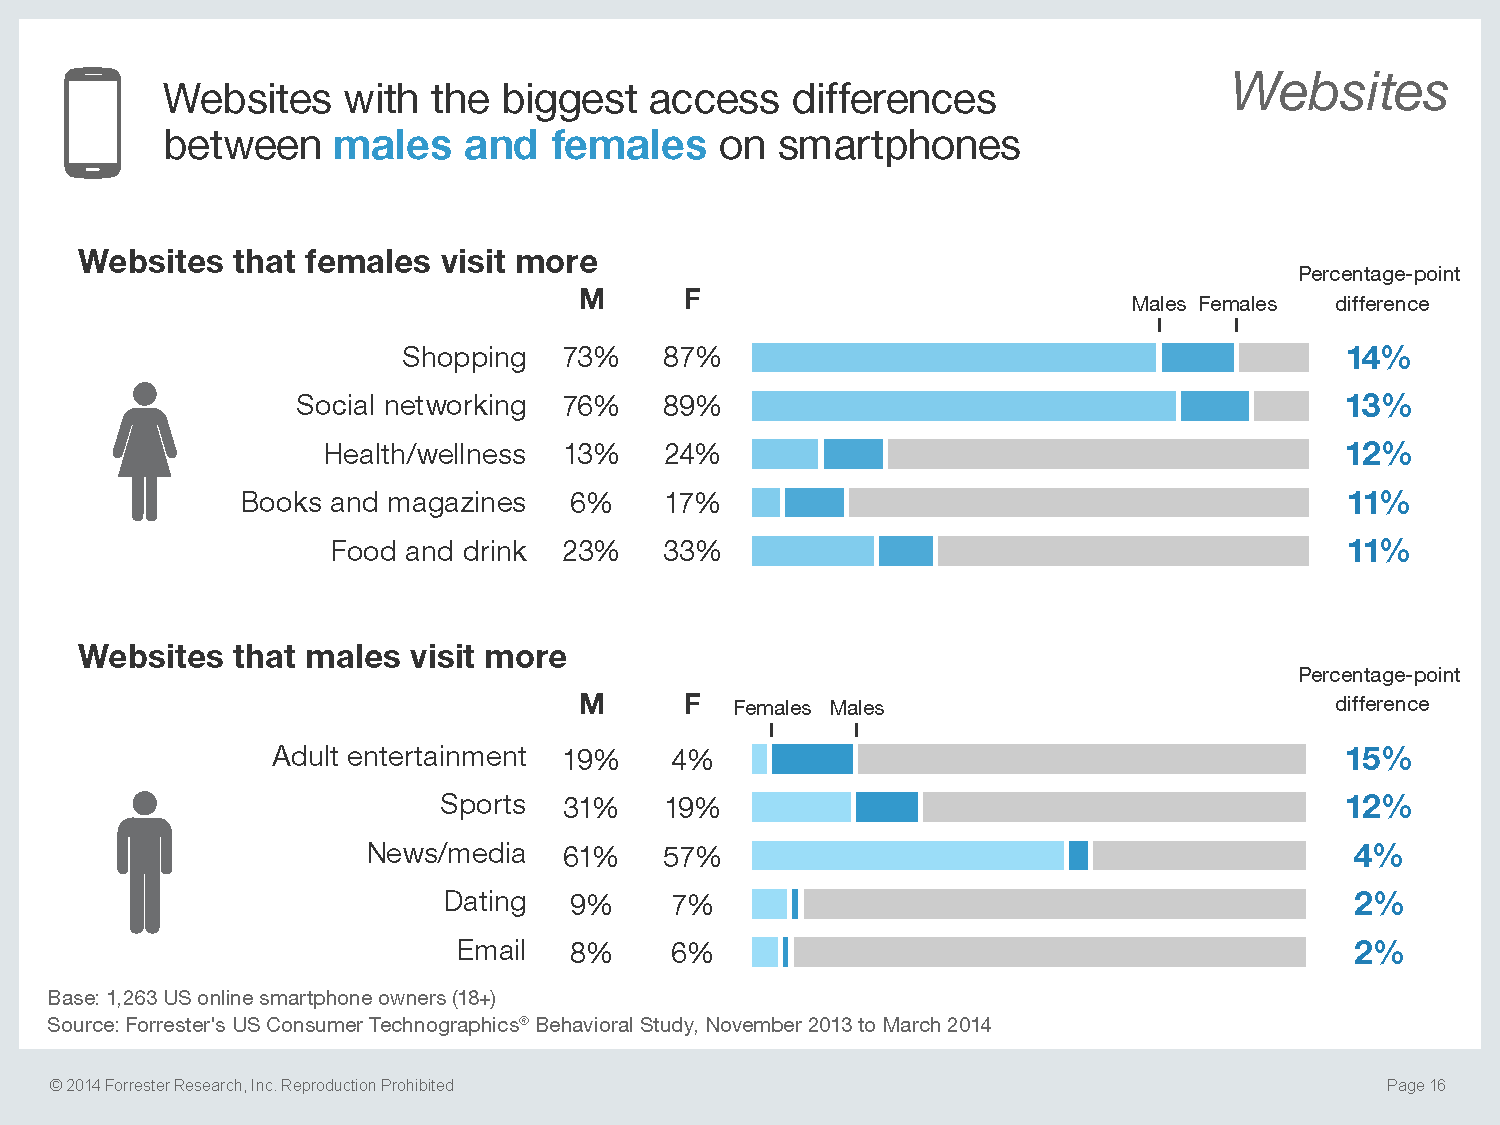
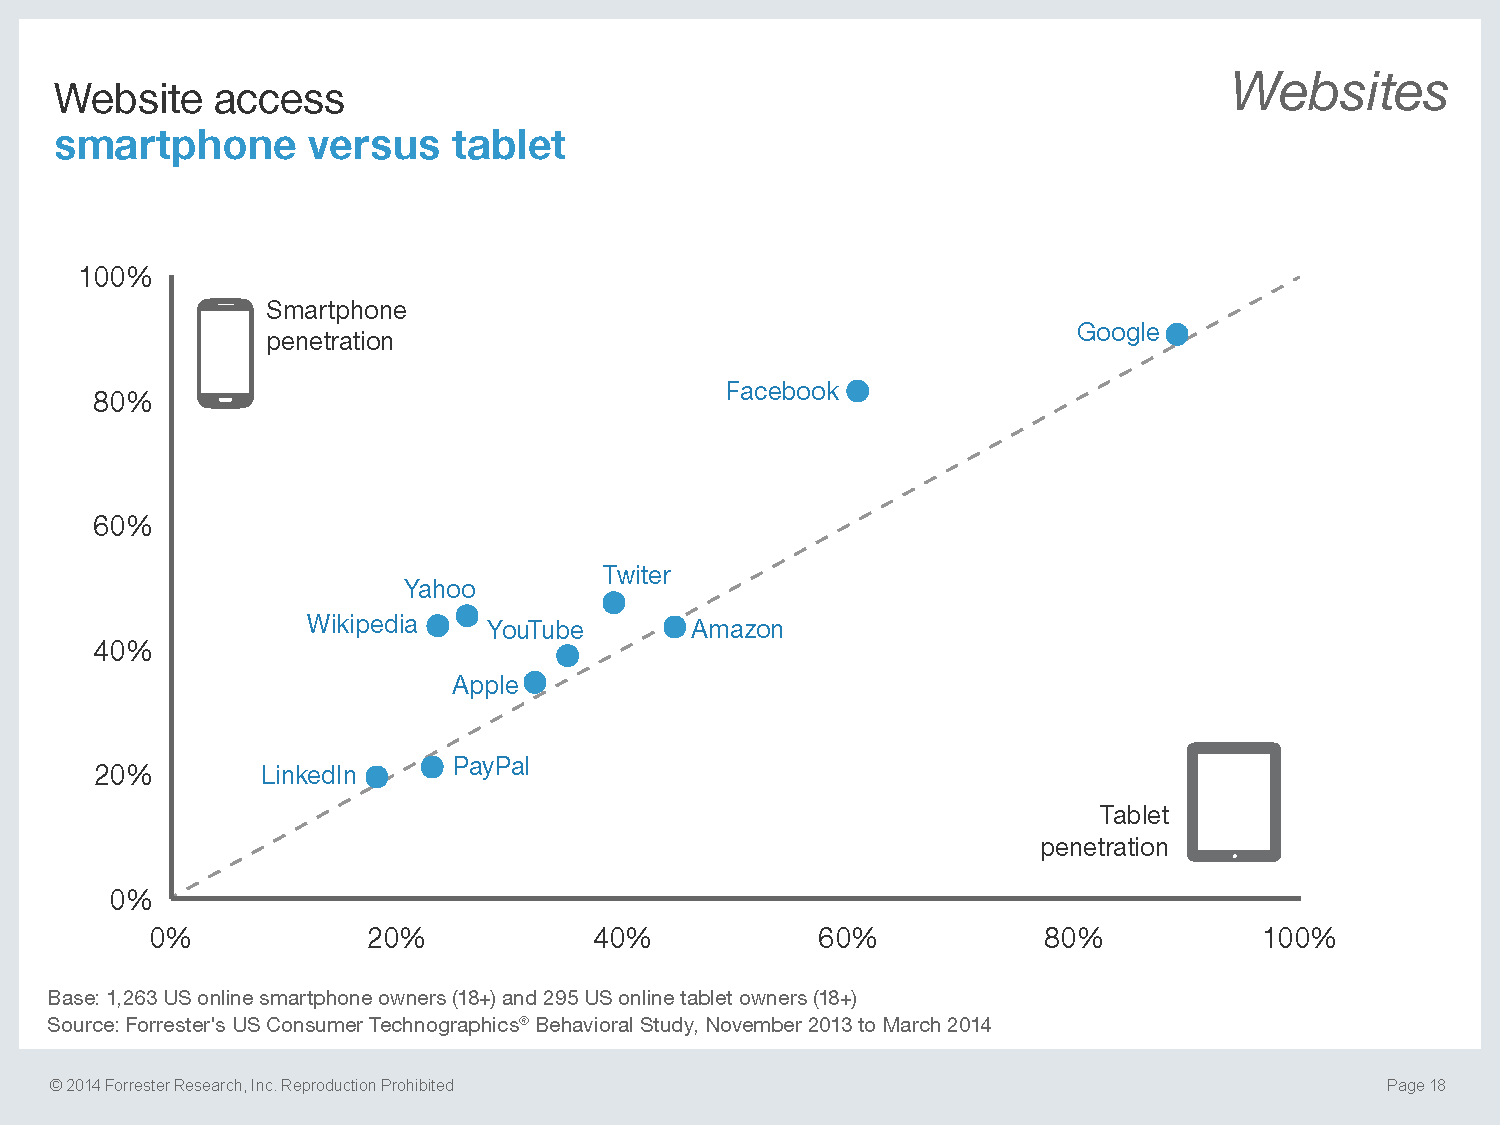
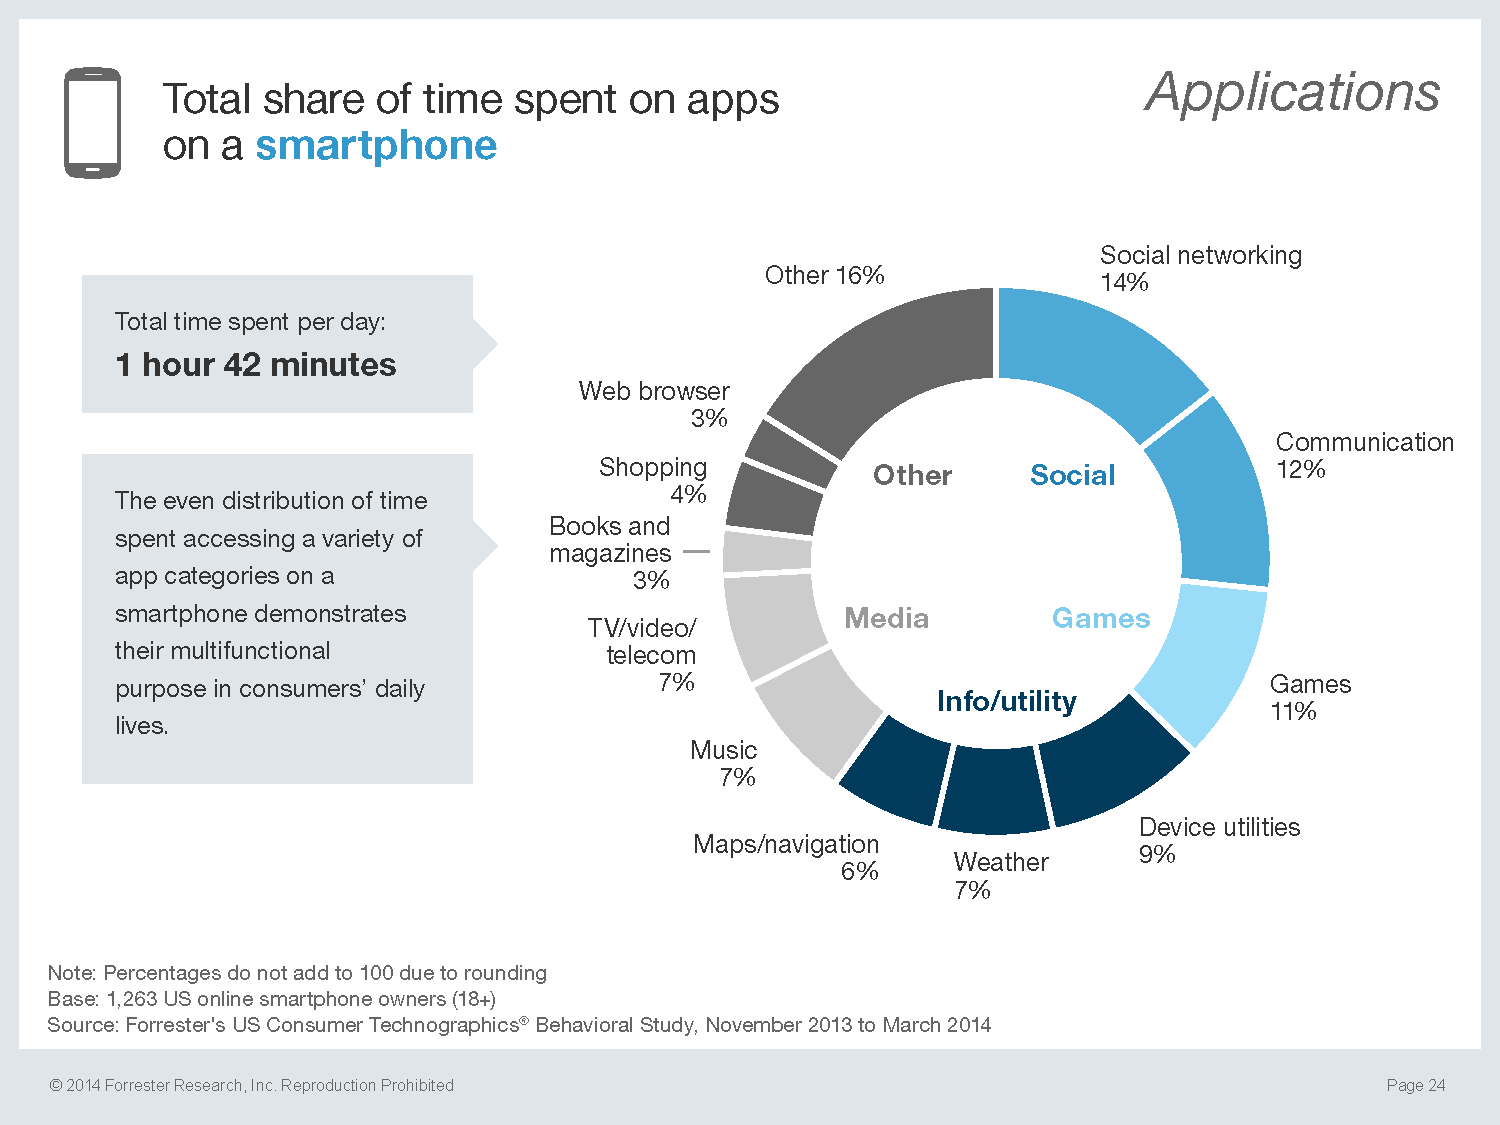
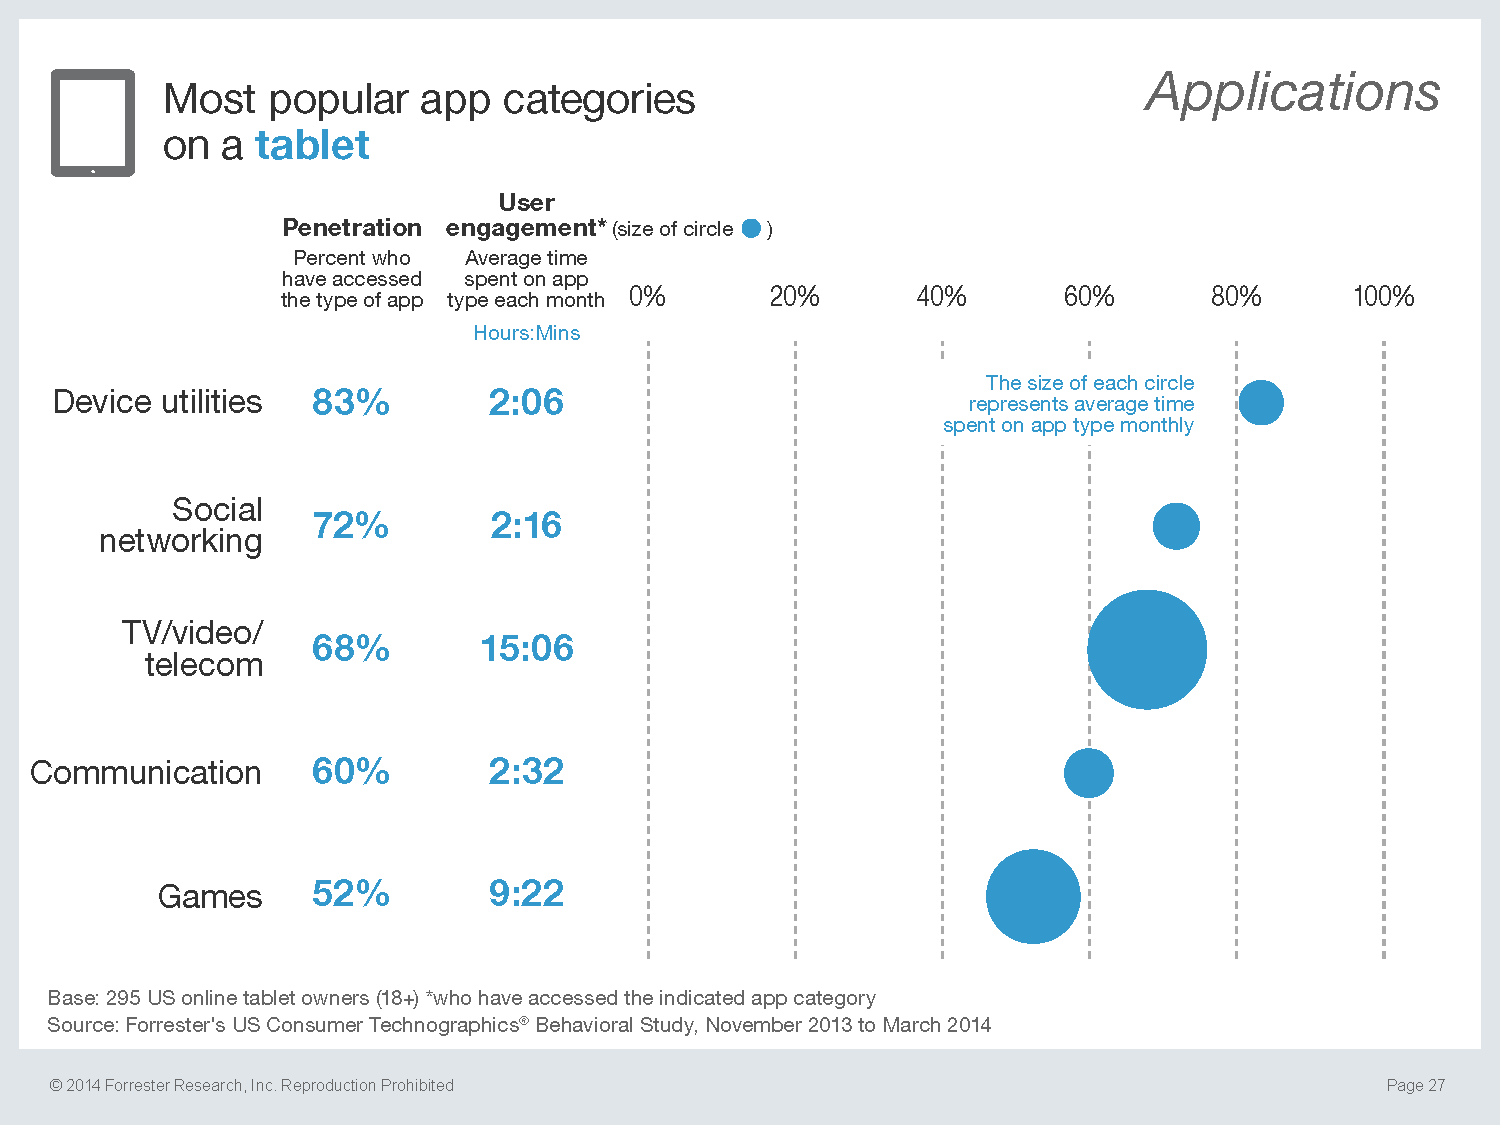
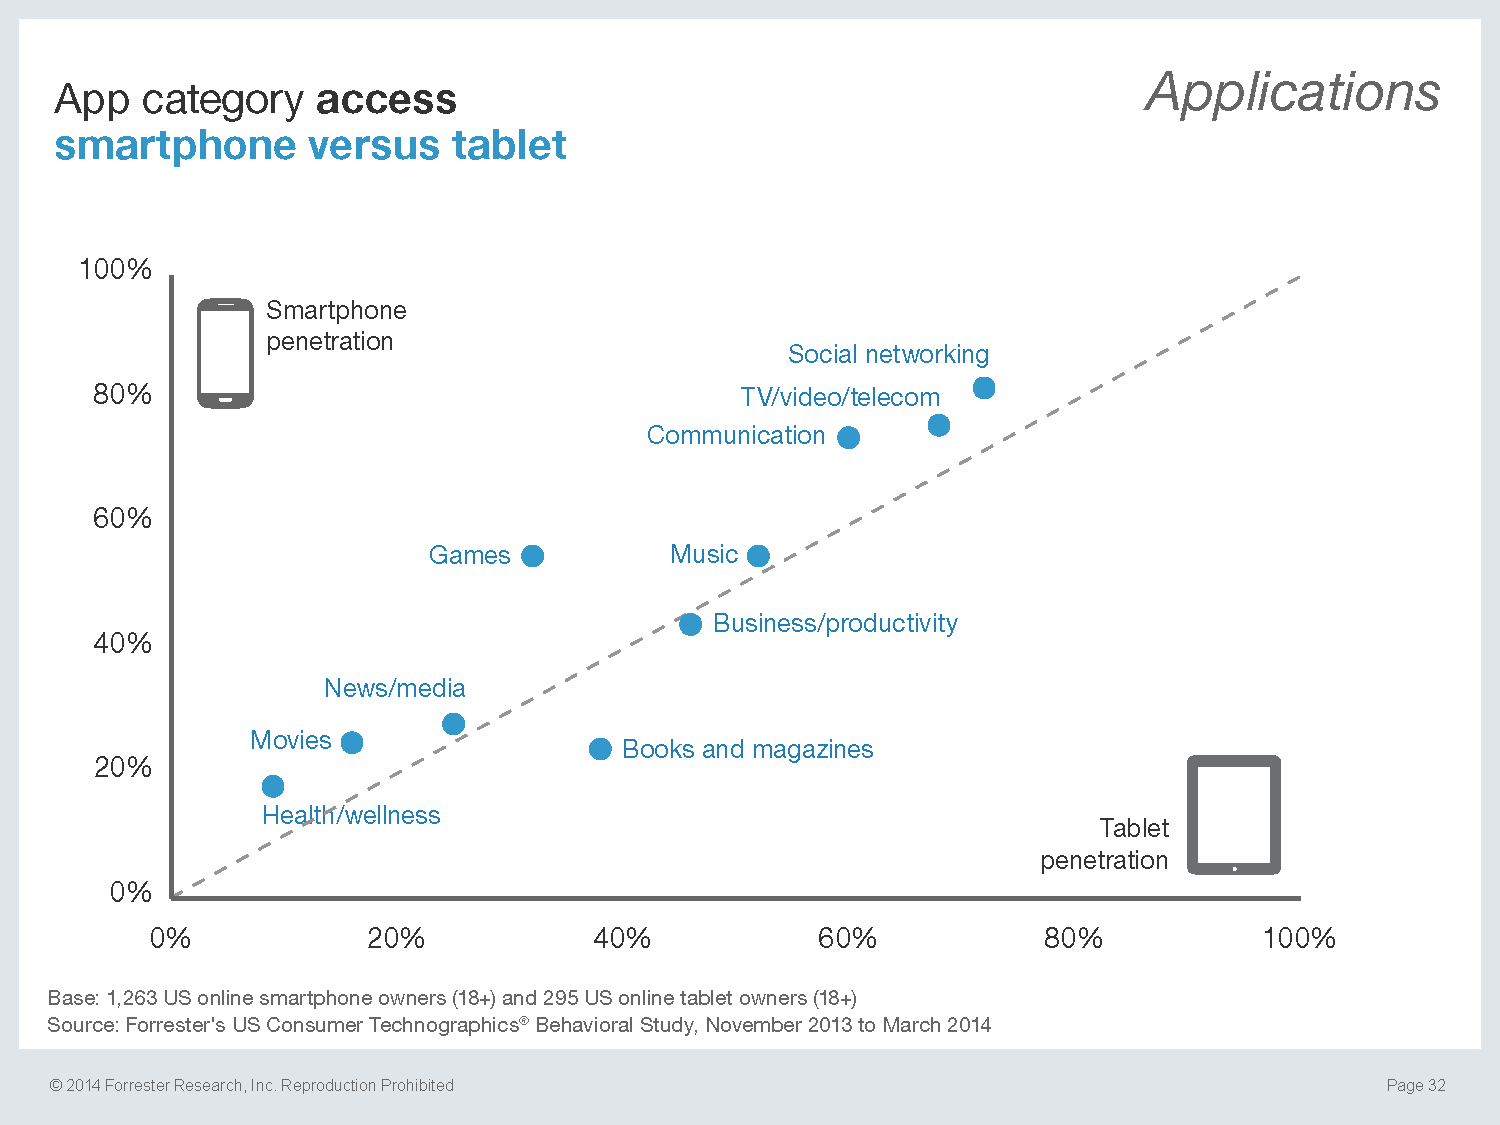
This project was an introduction to Forrester's new mobile behavioral data in 2014. The goal was to create a slide presentation that was both comprehensive in scope and approachable to someone unfamiliar with this new, multi-dimensional data. To tackle this, we used two key tactics: organization and a consistent, interface-style design. With multiple dimensions, it became important to break the overall presentation into a clear, logical hierarchy. It starts with apps vs. websites, then smartphone vs. tablet, then categories vs. individual apps, then by the variable we are specifically covering on each slide. This approach makes the data a bit more accessible by slowly introducing the concepts and keeping the visualization methods consistent. And, because all of the data is being visualized with the same methods and scales, everything is comparable, especially if slides are hand-picked and placed in a different presentation.
The second tactic involved creating an interface-like style that made it clear what was being viewed at all times. This approach takes advantage of the animation effect that happens when flicking through each slide. All the important explanatory information stays the same while the differences in data "animate." This approach is especially powerful when using the same visualization method and simply changing the underlying data that's feeding it (e.g., smartphones vs. tablets).
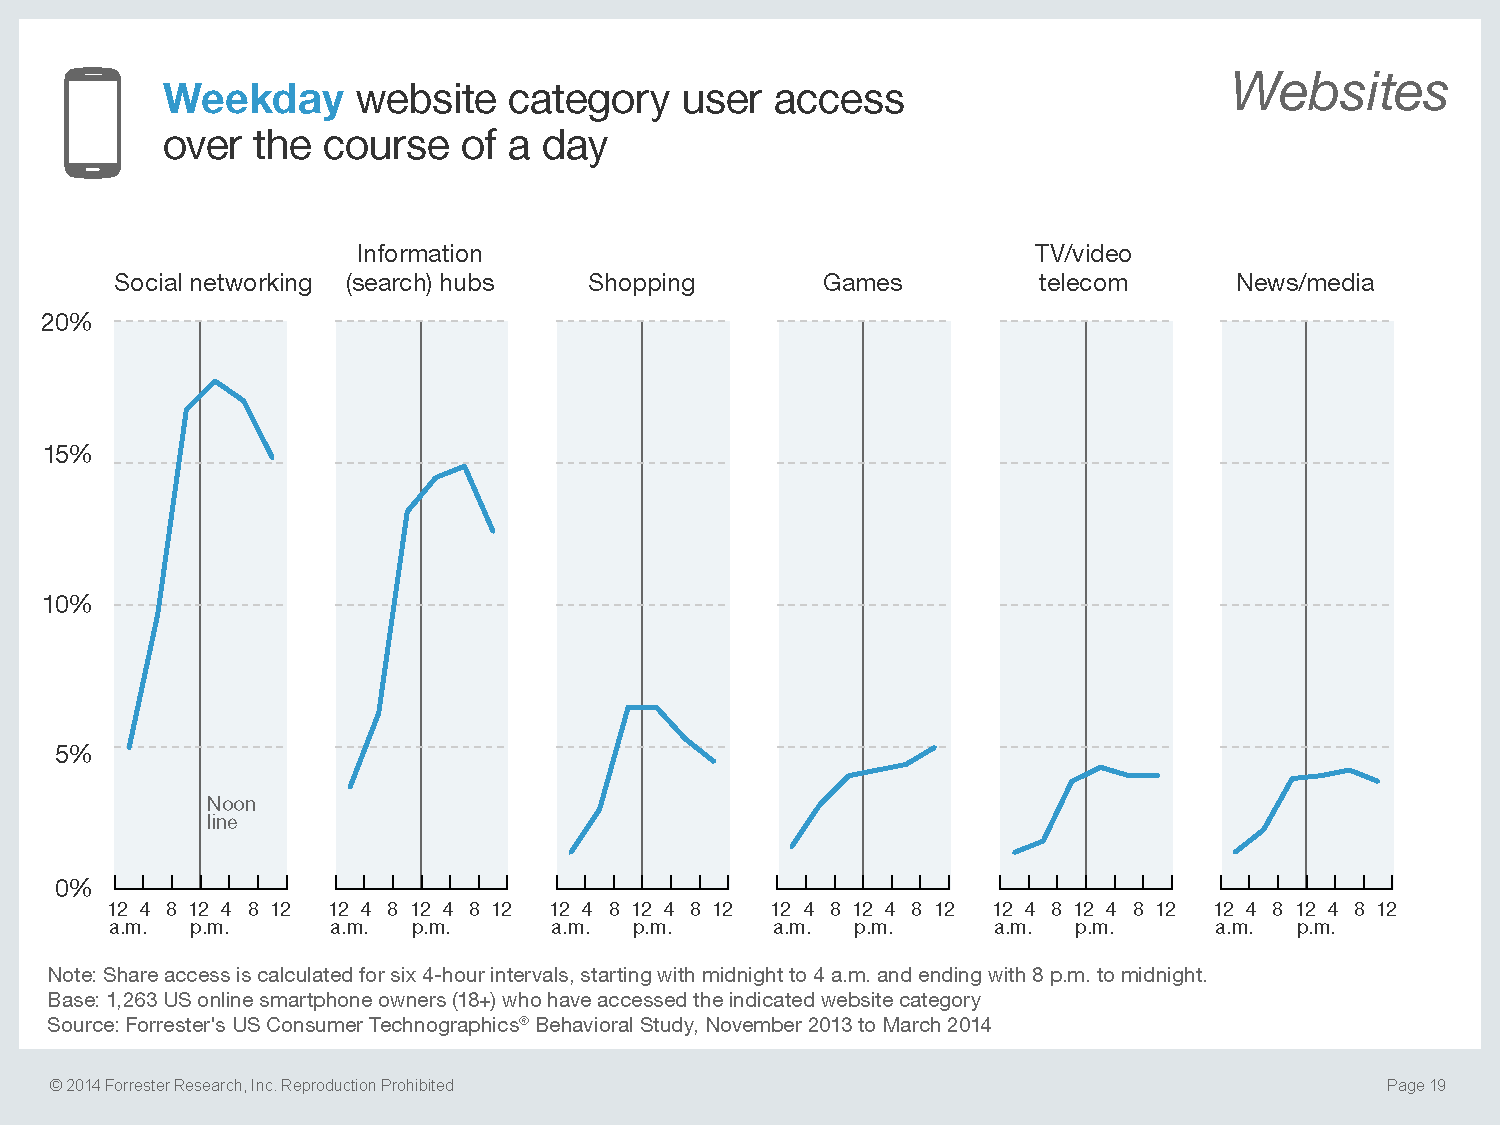
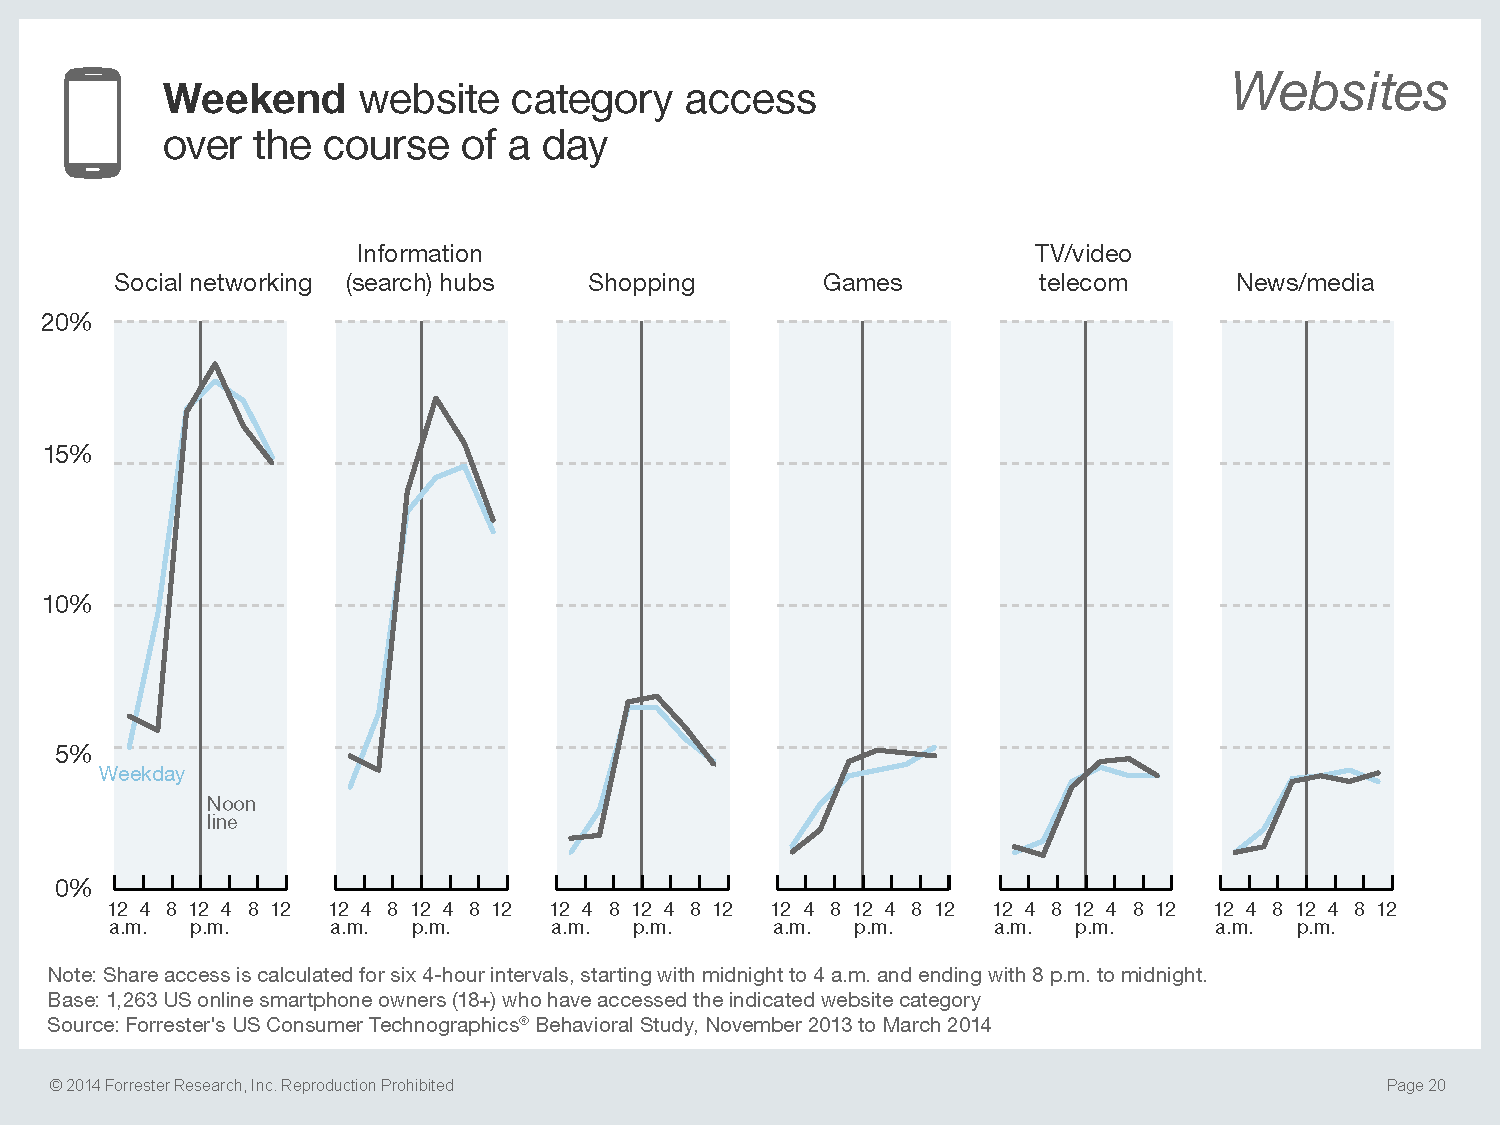
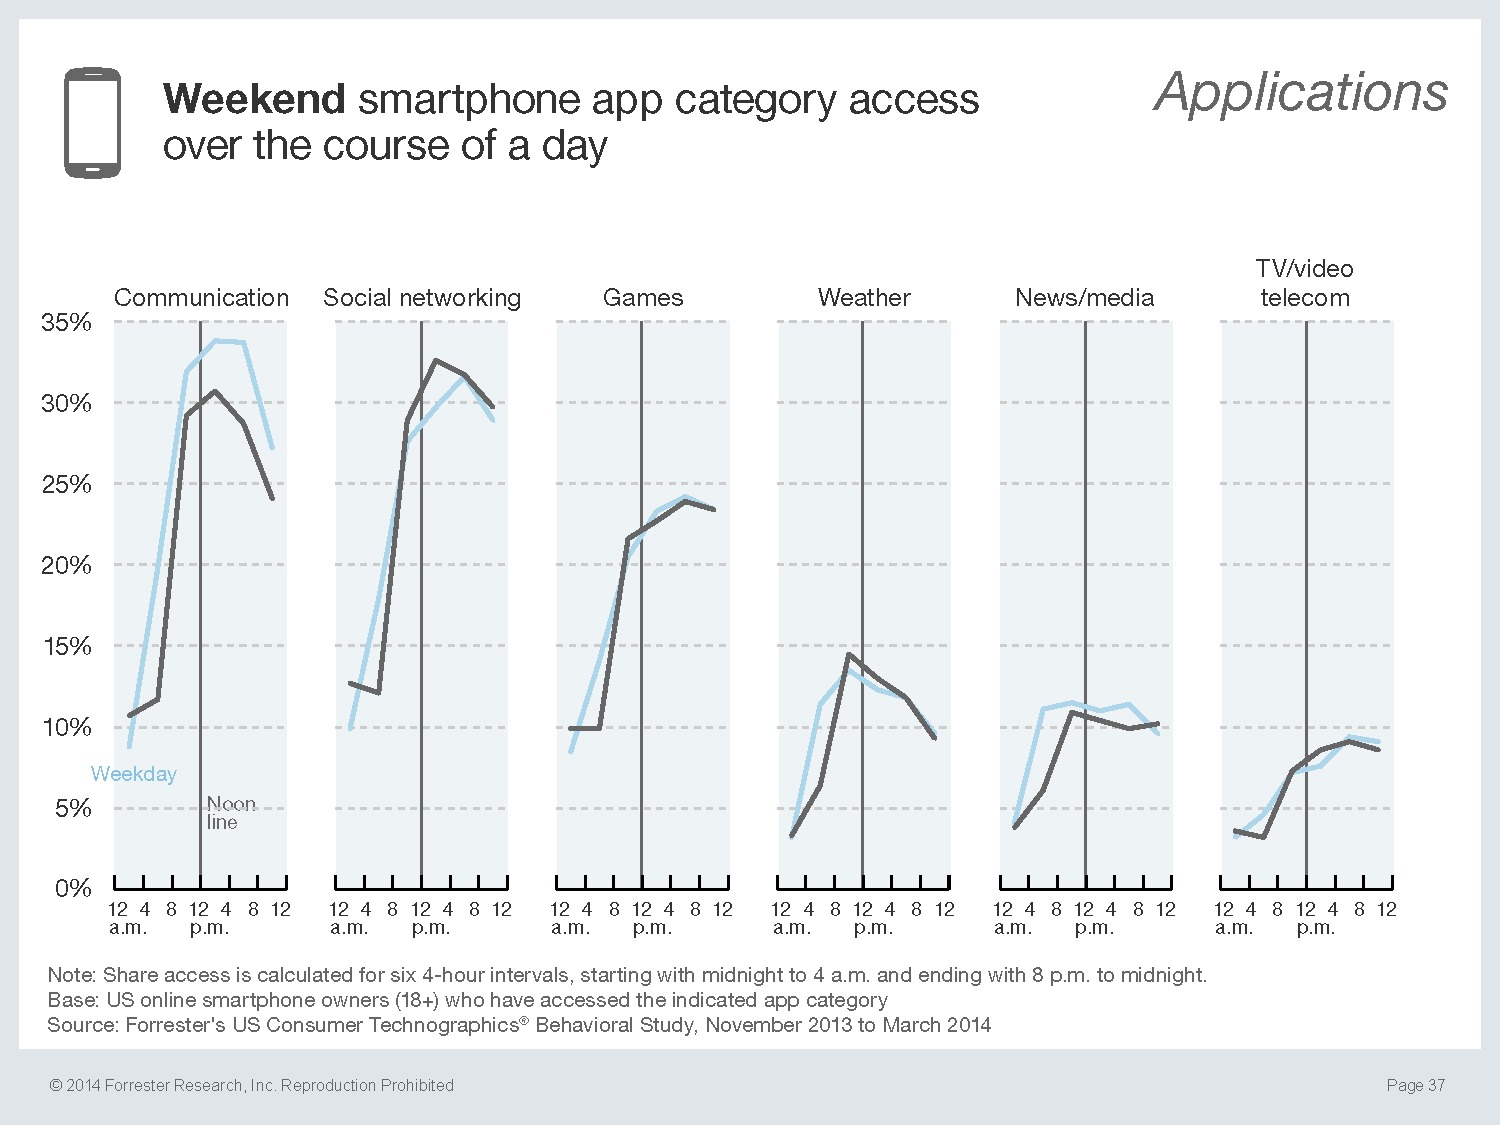
A good example from this project that uses the animation effect well is the example to the right. This graphic also uses one of my favorite techniques, small multiples. In this example, there were two key focal points: first how the apps generally compare against one another in terms of usage, and then how the apps compare against themselves during the weekdays and weekends. With small multiples and animation (which is like an additional level of multiples), this chart goes from something like we see on the top right to a much more approachable version, like the example below it.
generic excel output (above) vs. small multiples and animation (below)

