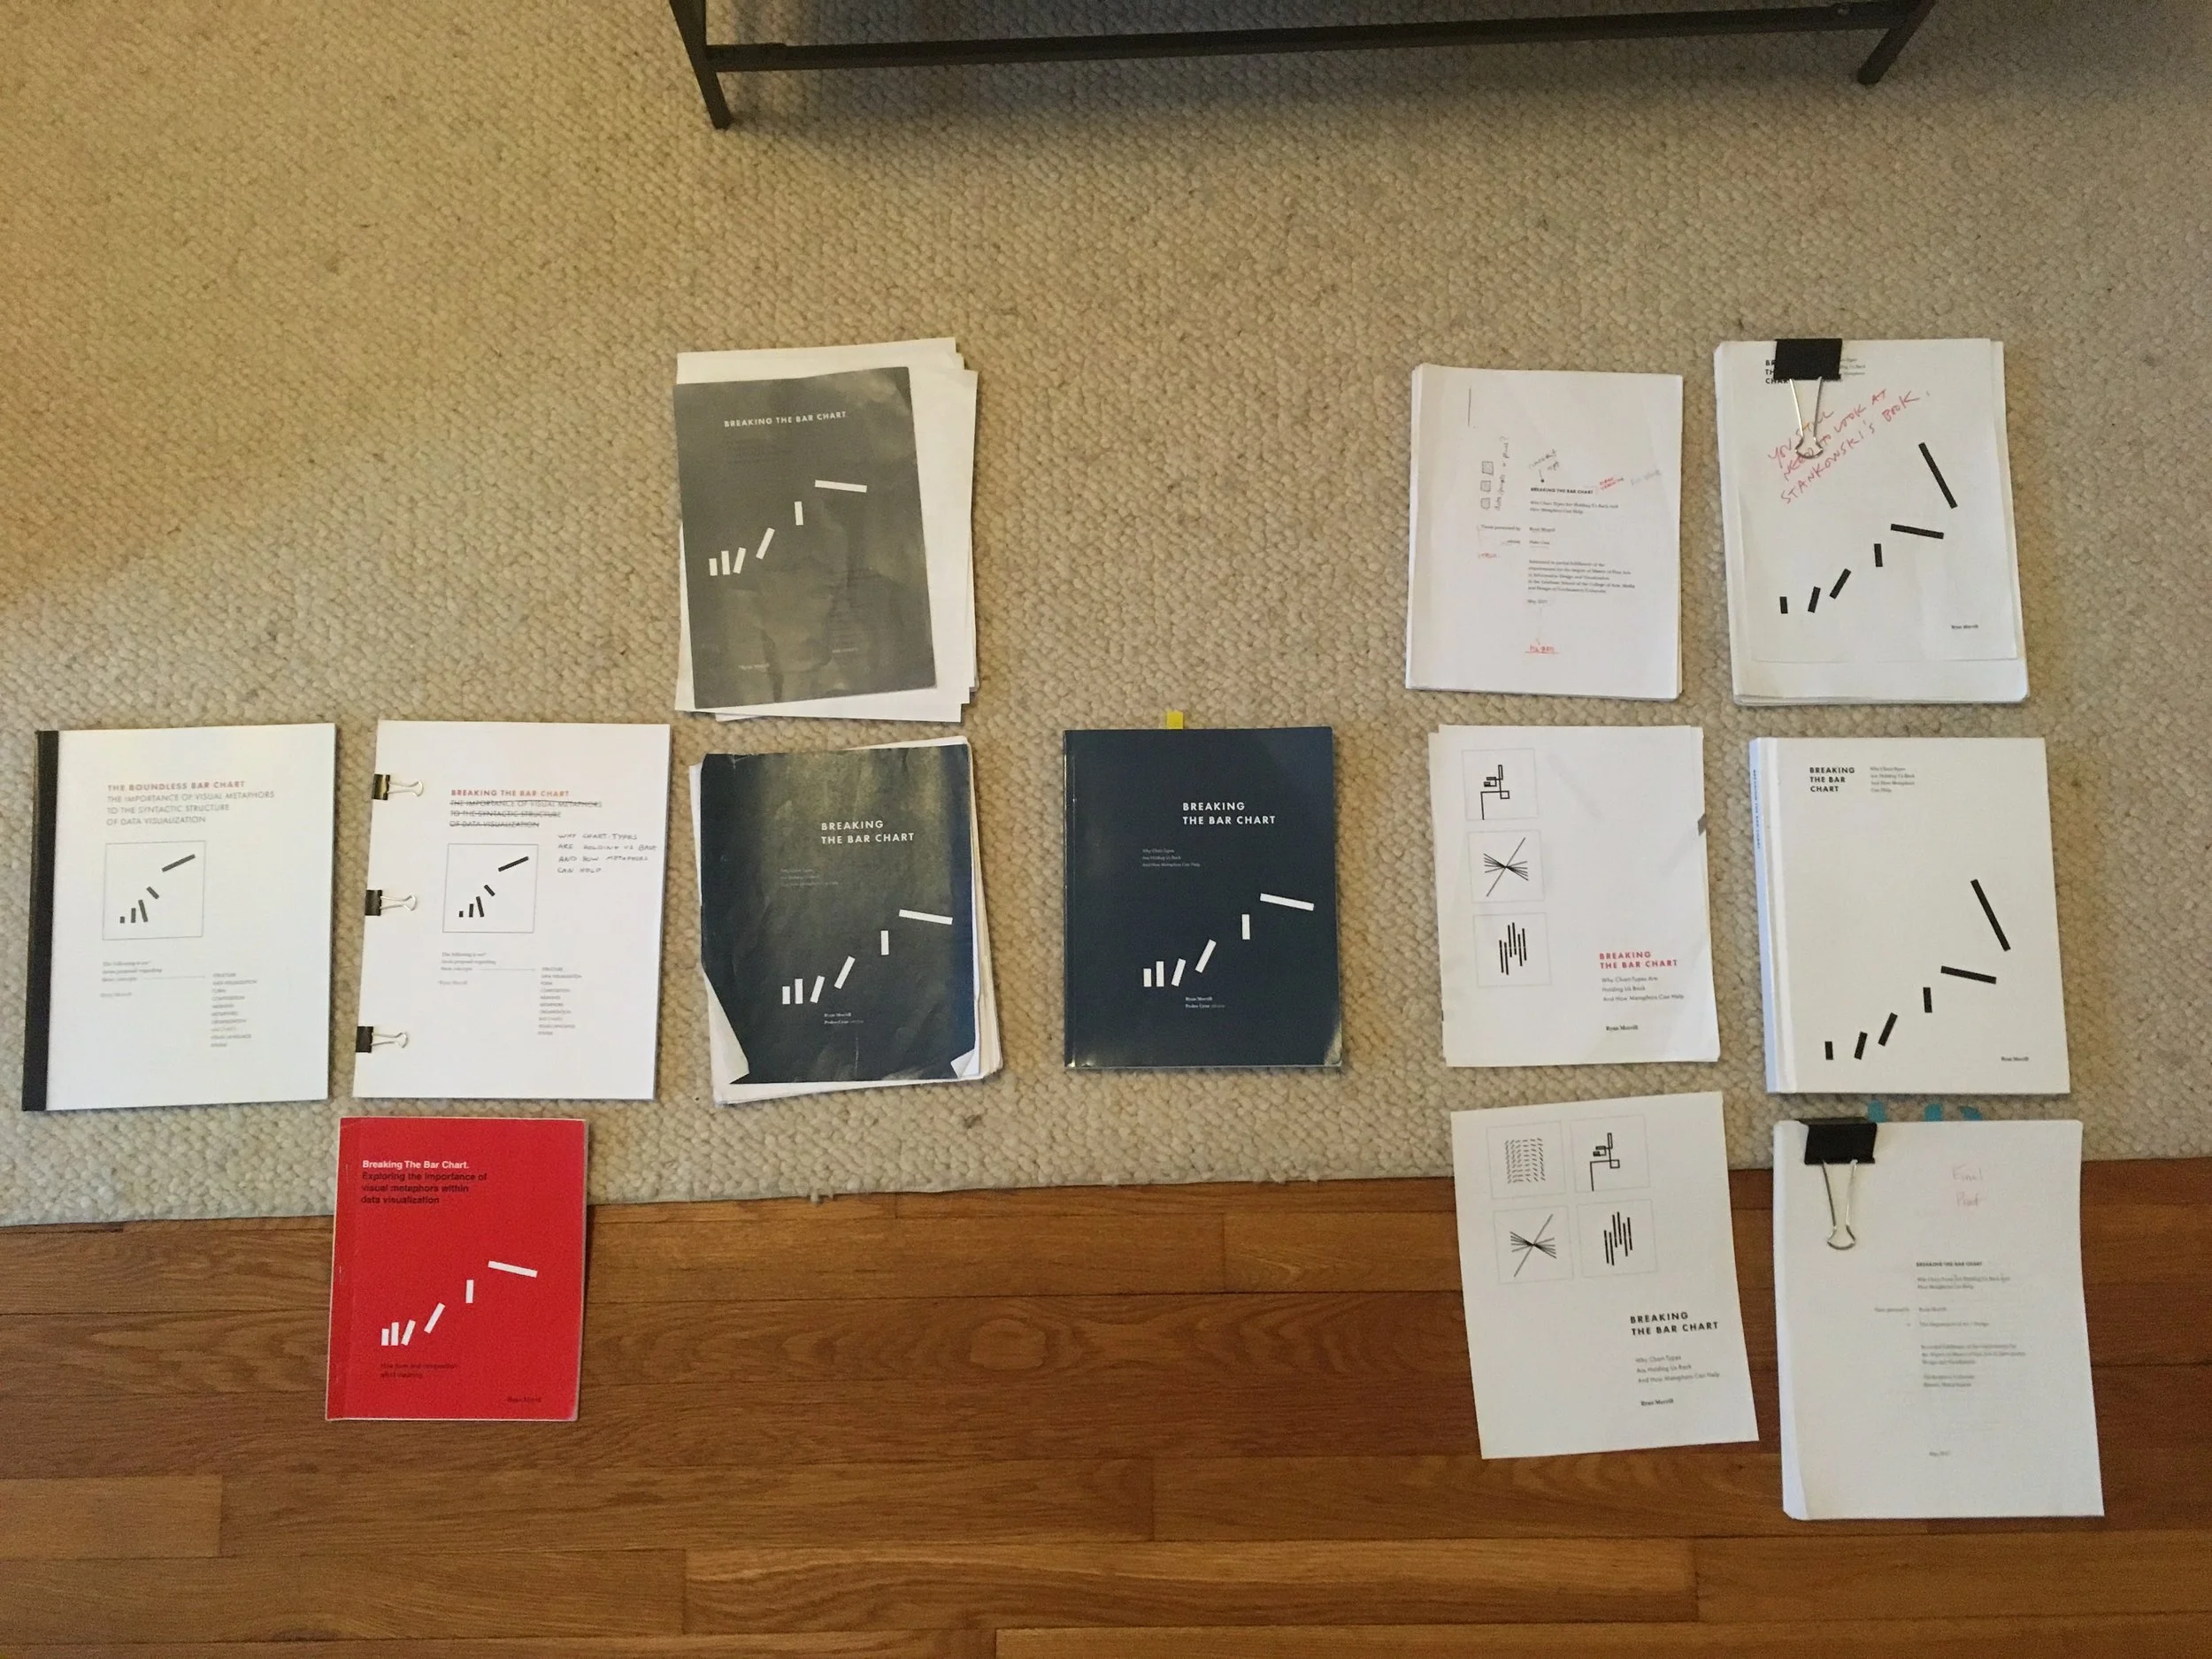
BREAKING THE BAR CHART
WHY CHART TYPES ARE HOLDING US BACK
AND HOW METAPHORS CAN HELP
This is my thesis which I presented to the department of Art + Design at Northeastern University in partial fulfillment of the degree of Master of Fine Arts
in Information Design and Visualization.
Winner of the Otto Neurath Award
for excellence in design inquiry
Abstract
Visualizing data is an exercise in organization. To learn more about something, we organize it: we group, cluster, categorize, and quantify. It’s through this process of learning and discovery that a visual form should take shape. However, it’s this process that’s missing when we select chart types. This thesis presents the process of visualizing data as a metaphoric alignment between the concept networks of the visual form and the data, both of which are metaphorically understood as entities that we can organize. This process is not a symbolic encoding; it’s an alignment of concepts that already exist in the visual form and the data. When we select pre-made forms, chart types, we do not have control of the concept networks or the organization methods. Because of this, the meaning of the form is not fully considered or understood by the designer. Additionally, the relationship between different visual forms is lost, leaving us with templated forms that we perceive as discrete and unrelated. For the end user, interacting with these discrete forms means navigating between them. This thesis presents a process where interaction is a systematic organization and transformation between different forms: interacting with the data itself.


